

A restaurant profit margin calculator is one of the most powerful tools in your arsenal. It takes all your raw sales and expense data and spits out a simple percentage, showing you exactly how much of your revenue you actually get to keep.
Think of it as the first step toward understanding the true financial health of your Los Angeles restaurant, whether you're running a bustling pizzeria, a nimble food truck, or a popular Mexican food spot. It helps you move past just tracking daily sales and start making strategic, data-driven decisions that actually move the needle.
Why Your Profit Margin Is More Than Just a Number
In the cutthroat Los Angeles restaurant scene, focusing only on daily sales is like trying to navigate the 405 with your eyes closed. High revenue looks fantastic on paper, but it tells you almost nothing about your actual profitability. The real story is in your profit margin—it’s the ultimate scorecard for your business's health.
Getting a handle on this metric is often what separates the thriving concepts—from Los Angeles pizza joints to local food trucks—from the ones that are constantly struggling to keep the lights on.

A restaurant profit margin calculator forces you to look beyond that top-line sales number and really dig into what happens to every dollar that comes through the door. It shines a bright light on the (sometimes startling) difference between what you charge for a dish and what you actually pocket after paying for ingredients, labor, rent, and everything else.
This kind of clarity is what you need to make smarter decisions about menu pricing, staffing levels, and even when it’s the right time to invest in new restaurant equipment.
Gross Profit vs. Net Profit
To truly get the full picture, you need to look at two different types of profit margins. They each tell a different part of your financial story.
- Gross Profit Margin: This one is all about the profitability of your menu itself. It’s the money left over after you subtract the Cost of Goods Sold (COGS)—basically, the direct cost of your food and beverage ingredients. A healthy gross margin means your menu is priced effectively against what it costs to make.
- Net Profit Margin: This is your real bottom line. It's the percentage of revenue you have left after all expenses are paid, including COGS, labor, rent, utilities, marketing, and insurance. This number tells you if your entire business model is actually sustainable.
A big gap between a high gross profit and a low net profit is a classic red flag for operators. It usually means that operational costs, like labor or your lease, are spiraling out of control, even if your menu is technically profitable on its own.
Benchmarking Your LA Restaurant
It’s one thing to know your own numbers, but it’s another to know how they stack up against the competition. Understanding where you stand is vital. The restaurant industry is famous for its thin margins, and knowing the benchmarks for your specific type of restaurant—be it a Mexican food concept or a Los Angeles food truck—can provide some much-needed context.
Whether you're slinging tacos in East LA or running a pizza joint in Orange County, these averages help you set realistic goals and spot potential problems before they become critical.
The financial pressure on independent restaurant owners is immense, which makes a firm grasp on profitability non-negotiable. To give you a better idea, here’s a quick look at what you can generally expect in the LA market.
LA Restaurant Profit Margins at a Glance
| Restaurant Type | Average Net Profit Margin |
|---|---|
| Full-Service Restaurant (Mexican, Pizza) | 3-6% |
| Quick-Service Restaurant (QSR) | 6-10% |
| Los Angeles Food Trucks / Ghost Kitchens | 10-30% |
As you can see, quick-service models tend to fare a bit better than full-service restaurants, and the lower overhead of food trucks and ghost kitchens can push those margins even higher. Your profit margin calculator needs to accurately account for your three biggest expense categories—labor, COGS, and occupancy—to paint an accurate picture.
For a more detailed look at the initial expenses that shape these margins, check out our complete guide on restaurant startup costs breakdown.
Calculating Your Gross Profit Margin
Alright, let's roll up our sleeves and get into the first number that really matters for your restaurant's health: the gross profit margin.
Think of this as the purest measure of how profitable your menu actually is. It cuts through all the noise of rent, labor, and utilities to answer one fundamental question: Are you making enough money on the food and drinks you sell compared to what the ingredients cost you?
This calculation is ground zero. It tells you exactly how much cash is left over from every sale just to cover your overhead and, hopefully, leave you with a profit.
Breaking Down the Gross Profit Formula
The math itself is pretty simple, but don't let that fool you. The power of this formula comes from plugging in accurate numbers. It’s all about isolating the relationship between what customers pay you and what you pay your suppliers.
Here’s the formula you’ll use:
Gross Profit Margin = (Total Revenue - Cost of Goods Sold) / Total Revenue
Let’s quickly define those two key pieces so we’re on the same page.
- Total Revenue: This one’s easy. It's the total cash you brought in from selling food and drinks over a specific time, like a month or a quarter. Simple enough.
- Cost of Goods Sold (COGS): This is where you need to be precise. COGS is the direct cost of the ingredients that went into the dishes you actually sold. It's not just your total food spend for the month; it’s a specific calculation that accounts for inventory.
A Quick Gut Check: A high gross profit margin is a great sign—it means your menu is fundamentally healthy. If it's low, that's your first major red flag. It’s a signal that your food costs are creeping up, your prices are too low, or you've got a waste or portioning problem on your hands.
Nailing Down Your Cost of Goods Sold
Here’s a classic mistake I see all the time: a restaurant owner just adds up their supplier invoices for the month and calls that their COGS. That will give you a completely skewed number. To get your true COGS, you have to factor in what you already had on the shelves.
The correct formula looks like this:
COGS = Beginning Inventory + Purchases - Ending Inventory
Let's break that down piece by piece:
- Beginning Inventory: This is the total dollar value of every food and beverage item you had in stock at the very beginning of the period.
- Purchases: This is the total value of all the new inventory you bought during that same period.
- Ending Inventory: Finally, this is the dollar value of whatever inventory you have left on the shelves at the very end of the period.
Solid inventory tracking is the absolute backbone of a reliable COGS figure. To get this right, you really need a firm grip on your stock. In fact, Mastering Inventory Management and Logistics is one of the most direct ways to control your COGS and boost your bottom line.
A Los Angeles Mexican Food Truck Example
Let’s make this real. Imagine "LA Al Pastor," a popular food truck slinging authentic Mexican food in Los Angeles. The owner wants to see how they did last month, so they're calculating the gross profit margin for July.
First, they pull their numbers together:
- Total Revenue for July: $30,000
- Beginning Inventory (July 1): $4,000 (value of all meat, tortillas, produce, etc.)
- Purchases during July: $8,000
- Ending Inventory (July 31): $3,000
Now, they can calculate their actual COGS for the month:
COGS = $4,000 (Beginning) + $8,000 (Purchases) - $3,000 (Ending)
COGS = $9,000
With their true COGS in hand, they can plug it all into the main formula:
Gross Profit Margin = ($30,000 - $9,000) / $30,000
Gross Profit Margin = $21,000 / $30,000
Gross Profit Margin = 0.70 or 70%
That 70% is a fantastic number. It means that for every single dollar in sales, LA Al Pastor keeps 70 cents to pay for everything else—labor, gas for the truck, permits, marketing, and profit. This tells the owner their menu pricing and food costs are in a very healthy spot.
Uncovering Your True Net Profit Margin
While gross profit is a great start, telling you how much you're making on your menu alone, the net profit margin is where the rubber really meets the road. This is the ultimate bottom line. It's the percentage of revenue you actually get to keep after every single bill is paid.
Think of it this way: net profit is the money that fuels your growth, pays down your loans, and, most importantly, ends up in your bank account. To figure this out, you have to take an honest, unflinching look at every dollar that flows out of your business.
The Big Three Expenses
For any restaurant, whether you're running a Los Angeles pizza place or a food truck in Orange County, your costs tend to group into three major buckets. We call these the "Big Three" because they’re the heavy hitters, eating up the biggest chunk of your revenue.
- Cost of Goods Sold (COGS): You already know this one from the gross profit calculation. It’s the direct cost of your food and beverage ingredients, and it's a foundational piece of the net profit puzzle.
- Labor Costs: This is usually the biggest expense category for any restaurant. It's not just the hourly wages and salaries you pay your team. It also includes payroll taxes, employee benefits, workers' comp insurance, and any overtime you dole out.
- Rent/Occupancy Costs: This covers your lease or mortgage payment, property taxes, and any common area maintenance (CAM) fees. It's a massive fixed cost that you have to cover every month, no matter how many customers walk through the door.
Of course, the spending doesn't stop there. You've got a whole list of other operating expenses to track meticulously if you want an accurate net profit figure. We're talking about utilities, marketing, insurance, licenses, repairs, and your POS system fees.
The net profit margin is the truest indicator of your business's viability. A healthy gross margin can easily be wiped out by uncontrolled labor or high overhead, which is why a detailed restaurant profit margin calculator is so essential for seeing the complete picture.
Putting the Net Profit Formula to Work
The formula itself is pretty simple, but its power comes from the quality of the numbers you plug into it. To get a result you can actually rely on, you have to account for every single expense.
Net Profit Margin = (Total Revenue - Total Expenses) / Total Revenue
Let's walk through a real-world scenario to see it in action. We'll use a hypothetical Los Angeles pizza place, "LA Pizza Pie," and look at their numbers for one month.
LA Pizza Pie: A Net Profit Example
First thing's first, we need to gather all the financial data for this Los Angeles Pizza restaurant for the month:
- Total Revenue: $80,000
-
Total Expenses: This is where we need to break everything down.
- COGS: $22,400 (28% of revenue)
- Labor Costs: $25,600 (32% of revenue)
- Rent & Utilities: $10,000
- Marketing & Advertising: $3,200
- Insurance, Licenses & Fees: $2,400
- Repairs & Maintenance: $800
- Other Operating Costs: $1,600
Now, let's add up all those expenses to get our total:
$22,400 + $25,600 + $10,000 + $3,200 + $2,400 + $800 + $1,600 = $66,000
With our total expenses calculated, we can finally plug everything into the net profit formula:
Net Profit Margin = ($80,000 - $66,000) / $80,000
Net Profit Margin = $14,000 / $80,000
Net Profit Margin = 0.175 or 17.5%
That 17.5% is an exceptionally strong net profit margin. It tells us that LA Pizza Pie isn't just pricing its menu effectively; it's also doing a fantastic job of keeping its operational costs, powered by quality restaurant equipment, under control.
The diagram below shows the basic flow for that first step—gross profit—where you start with revenue and subtract only the direct cost of your ingredients.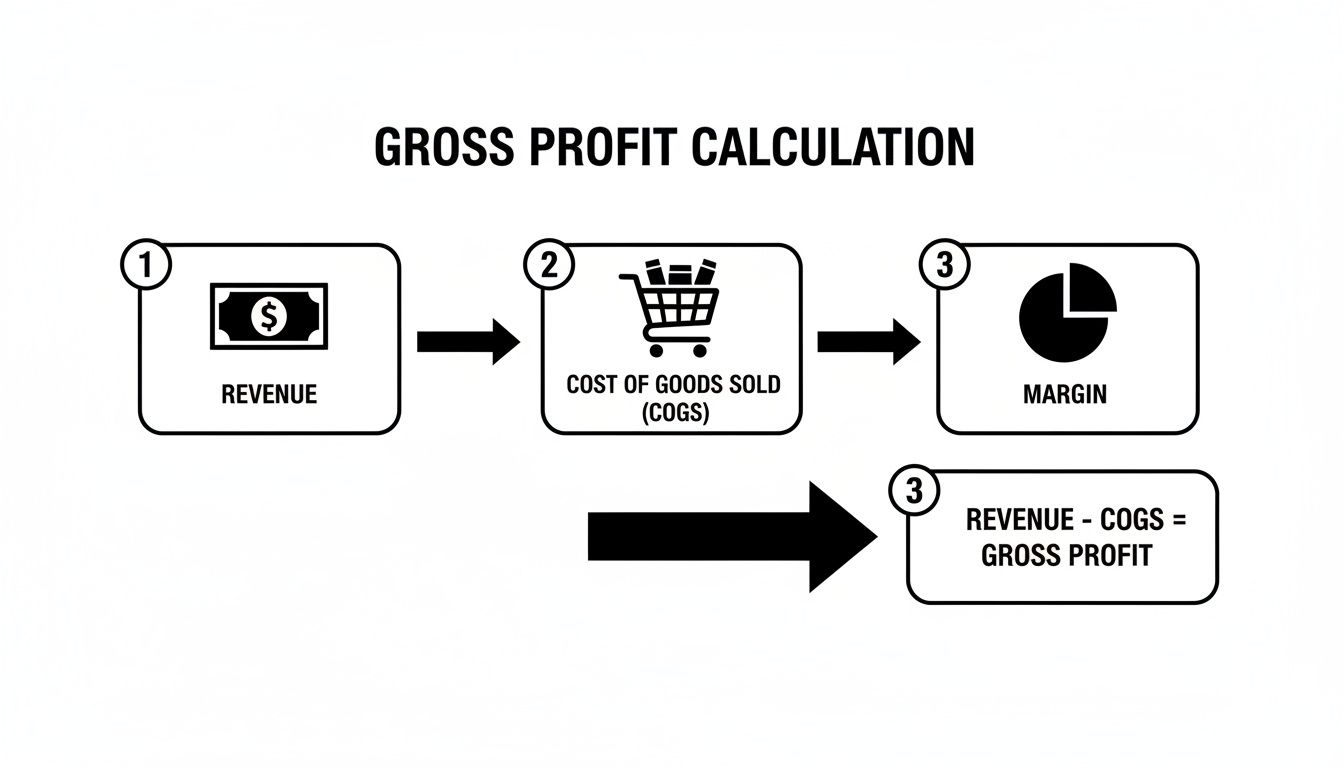
Getting a solid handle on this calculation is the crucial first step before you can accurately figure out your final net profit margin.
The global restaurant industry is booming, recently valued at $4.03 trillion and projected to hit $6.81 trillion by 2032. Here in the U.S., the industry hit $1.5 trillion in sales, with dine-in restaurants making up 73% of that. For Southern California's independent restaurant and food truck owners, this means there's a huge opportunity. But it also comes with big challenges like margin compression, especially when third-party delivery apps can skim up to 30% right off the top. You can dig deeper into these global restaurant industry statistics to see what they mean for your business.
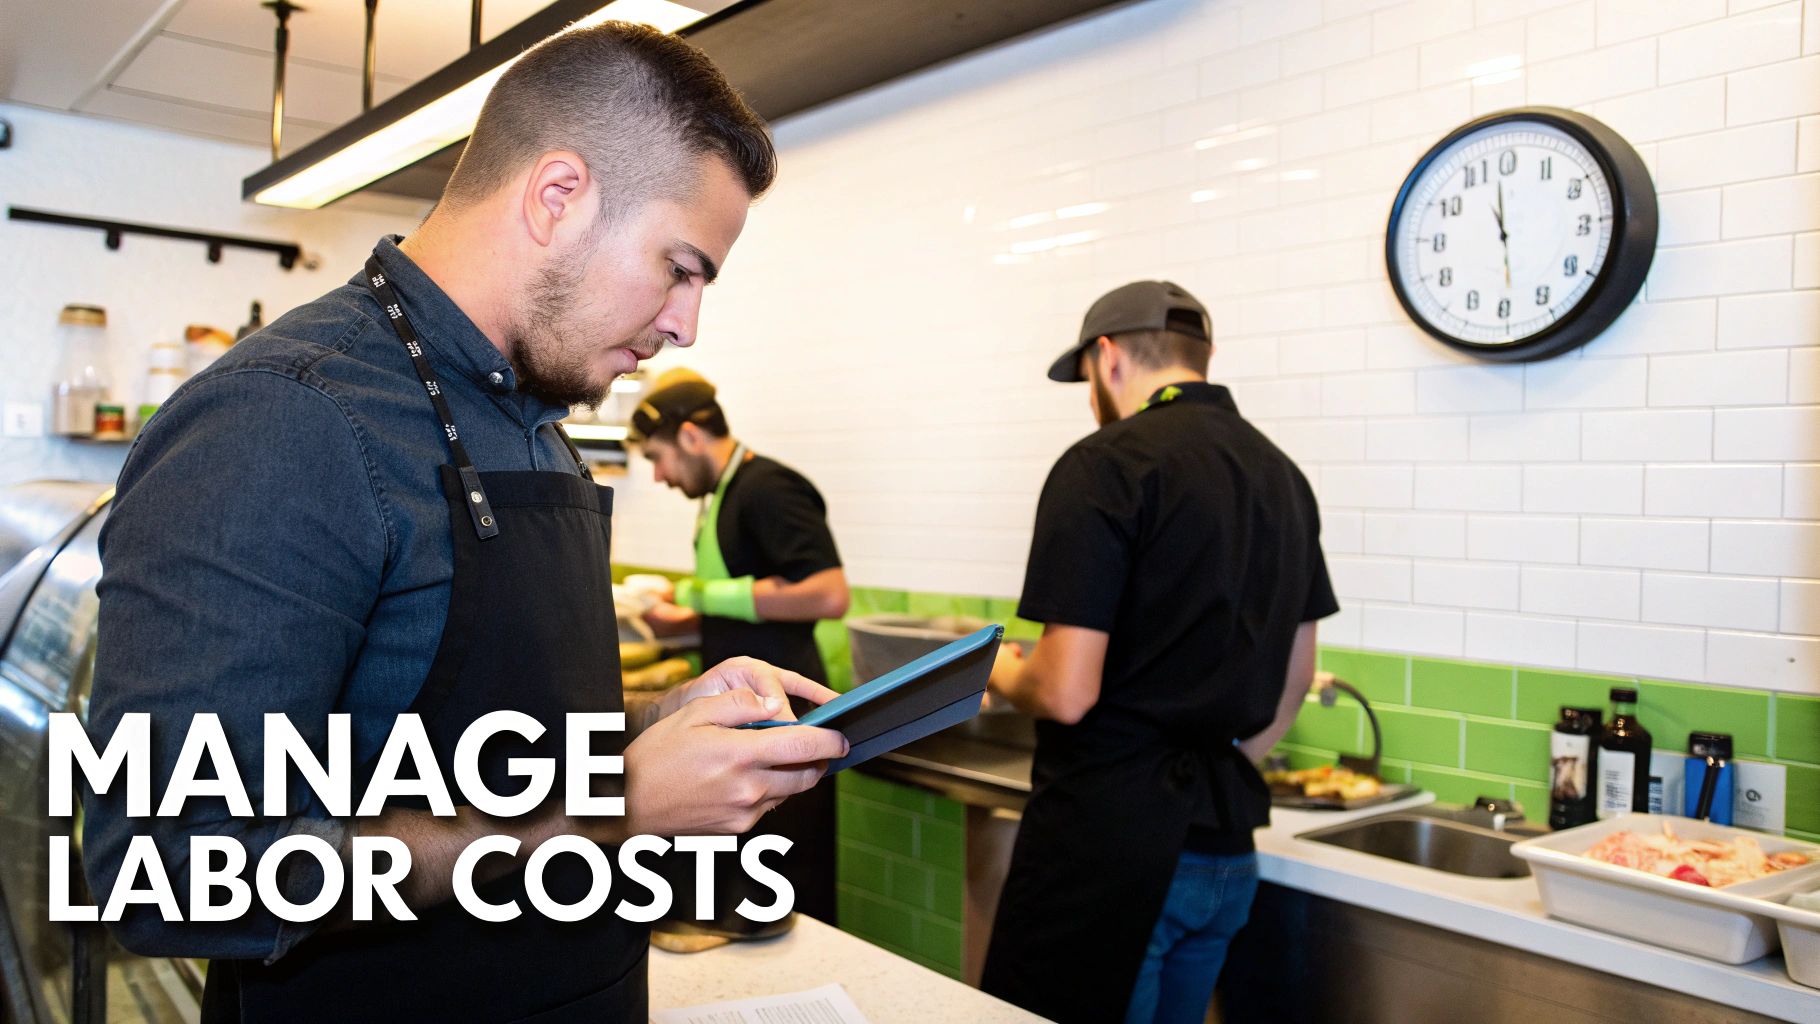
Managing Your Biggest Expense: Labor Costs
Once you've gotten a handle on your Cost of Goods Sold, your next big challenge is labor. For any restaurant in the competitive Southern California market, it's often the single largest and most unpredictable expense on the books.
It’s a real balancing act. You need a talented, motivated team to give guests a great experience, but runaway labor costs can completely wipe out an otherwise healthy gross profit margin. This is where your profit margin calculator shifts from a simple tool to an essential part of your management strategy.
When you start plugging your labor numbers in, remember you’re looking at more than just hourly wages. You need the whole picture: salaries, payroll taxes, benefits, and overtime. Seeing that total cost is what allows you to make smart scheduling and operational calls that actually protect your bottom line.
Optimizing Your Schedule for Peak Profitability
A classic mistake is scheduling based on a gut feeling instead of cold, hard data. Having too many people on the floor during a slow Tuesday lunch can hurt you just as much as being short-staffed during a Friday night rush.
Effective scheduling always starts with your sales data. Pinpoint your busiest hours and days, then build your schedule to match that customer demand precisely. This ensures every dollar you spend on labor is actually productive.
Cross-training your staff is another game-changer. A cook who can also jump on the prep line or a server who can step behind the bar gives you incredible flexibility. You can run leaner shifts without ever sacrificing the quality of service, which is a direct boost to your labor cost percentage.
When you're trying to manage this massive expense, it's crucial to look beyond just the paychecks. Understanding a comprehensive labor cost formula is the only way to truly see how it impacts your restaurant's profitability.
Leveraging Technology and Equipment to Boost Efficiency
Think of modern restaurant equipment as a strategic investment in labor efficiency, not just a capital expense. For a pizza spot in LA, a high-capacity prep station can slash the time it takes to build pies, letting a smaller crew handle a much higher volume of orders. For a busy Mexican food truck, a new high-efficiency fryer cooks food faster and more consistently, improving throughput and lowering labor hours per dollar of revenue.
The right equipment empowers your team to do more in less time. It reduces manual prep, streamlines workflow, and minimizes the physical strain on your staff, which can also help reduce turnover.
Investing in technology is just as critical. Modern POS systems and scheduling software can automate tasks that used to eat up hours of a manager's day. This frees them up to focus on what really matters—training their team, coaching, and improving the guest experience—instead of getting buried in administrative busywork.
The Real Impact of Labor on Your Bottom Line
It’s no secret that labor costs are one of the biggest weights on a restaurant's profit margin. Recent industry data is pretty sobering: 51% of restaurants saw their labor costs jump by up to 5%, and another 41% saw increases between 5-14%. For an independent owner in the Los Angeles area, getting a firm grip on these numbers is essential.
Here’s a practical checklist to help you get started on controlling those costs.
Labor Cost Control Checklist
This table breaks down some key strategies and the tech that can help you manage and reduce your labor expenses effectively.
| Strategy Area | Actionable Tip | Potential Impact on Margin |
|---|---|---|
| Data-Driven Scheduling | Use POS sales data to build schedules that match customer traffic patterns exactly. | Reduces overstaffing during slow periods, saving on unproductive wages. |
| Staff Training & Development | Implement a cross-training program so staff can cover multiple positions. | Increases operational flexibility and allows for leaner, more efficient shifts. |
| Technology Integration | Adopt modern scheduling software with forecasting and overtime alerts. | Automates a time-consuming task and prevents costly, unplanned overtime. |
| Equipment Upgrades | Invest in high-efficiency kitchen equipment that speeds up prep and cook times. | Increases kitchen throughput, allowing fewer staff to handle more orders. |
| Performance Management | Hold regular, brief performance check-ins to reinforce efficiency goals. | Keeps labor productivity top-of-mind and encourages a culture of efficiency. |
By actively managing your labor costs with a data-driven approach, you can turn your biggest expense into a controllable asset. This proactive management is a critical component of building a resilient and profitable restaurant, especially as you navigate the complexities of starting a new establishment. For more guidance on this topic, you might be interested in: our guide on how to start a restaurant.
Boosting Margins with Smart Equipment Investments
Your kitchen equipment is so much more than a collection of stainless steel appliances—it's one of the most powerful levers you can pull to directly impact your profitability. Too many operators get stuck seeing equipment as just a cost center, a necessary but painful expense.
Shifting that mindset is the first step. When you start viewing the right tools as a strategic investment, you'll find it's one of the best ways to lower your operating costs and see better numbers on your restaurant profit margin calculator.
This is where your financial data gets real, connecting the numbers on a spreadsheet to the day-to-day chaos of your kitchen. Every single piece of restaurant equipment has a direct line to your two biggest variable expenses: your Cost of Goods Sold (COGS) and your labor.
Think about it. A modern, high-efficiency convection oven cooks faster and more evenly. That doesn't just mean a better product for your customers. It means shorter cook times, a higher capacity during a dinner rush, and a smaller utility bill at the end of the month.
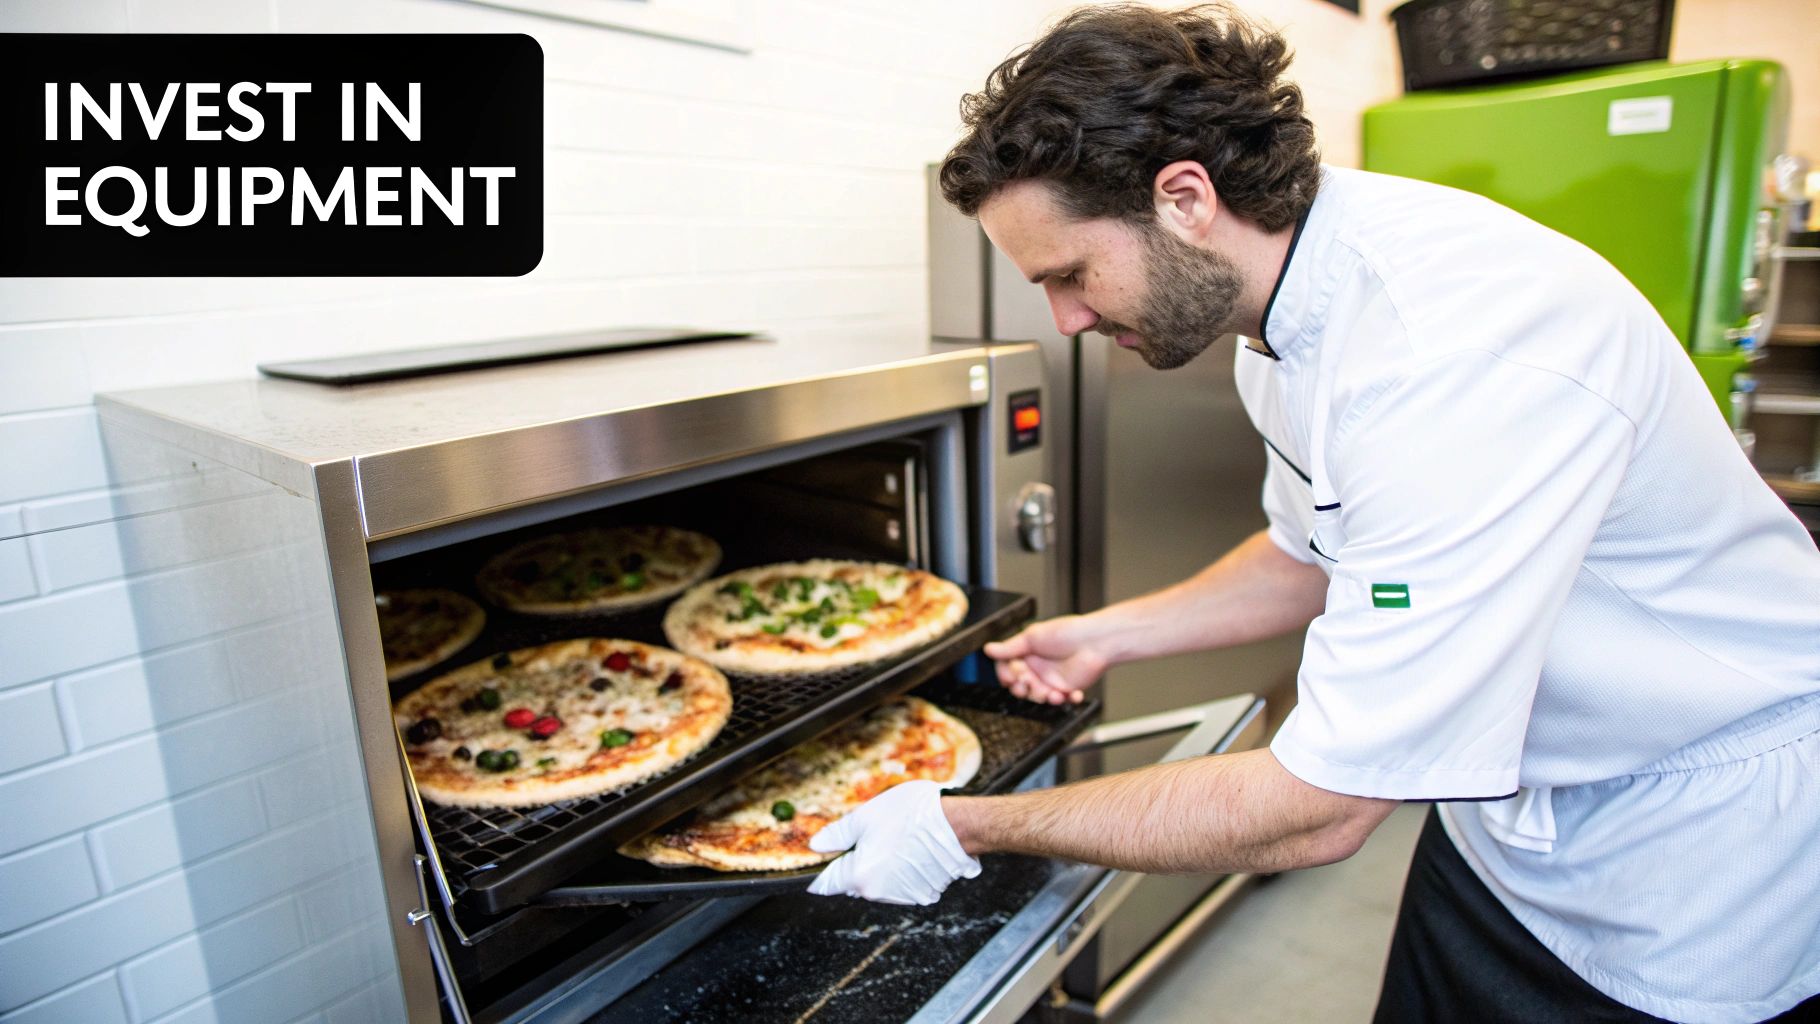
It’s all about the ripple effect. An energy-efficient walk-in cooler might sting a bit upfront, but it can literally save you hundreds of dollars a year on electricity. For a busy Los Angeles pizza joint, a new pizza prep table with top-tier refrigeration can slash food waste by keeping toppings fresher for longer. That directly lowers your COGS. These are the real, tangible connections between smart spending and a healthier bottom line.
Calculating Equipment Return on Investment
Making the right call means getting past gut feelings and using real data to justify a purchase. Before you drop cash on a new piece of gear, you have to calculate its potential Return on Investment (ROI). It’s a straightforward calculation that tells you exactly how fast that new asset will pay for itself.
The basic formula is pretty simple:
ROI (%) = (Net Gain from Investment / Cost of Investment) x 100
Let’s run the numbers on a real-world scenario. Imagine a popular Mexican food truck in Orange County is eyeing a new $3,000 high-capacity fryer.
- The Old Way: Their current fryer is slow and eats energy. It costs them an extra $50 a month in utilities and forces them to spend an extra $400 in labor just to keep up with orders during peak hours.
- The New Way: The new fryer will completely eliminate those extra costs, saving them $450 every month. That's a total savings of $5,400 per year.
Now, let's plug those numbers into the ROI formula for the first year:
ROI = ($5,400 / $3,000) x 100 = 180%
A 180% ROI in the first year is a home run. That fryer won't just pay for itself in under seven months—it will become a pure profit-driver for years to come.
This data-backed approach transforms a major purchase from a scary expense into a calculated strategic move. You can confidently invest in upgrades that will actively improve your profit margin instead of just crossing your fingers and hoping for the best.
Making Upgrades Affordable with Financing
For a lot of independent operators and food trucks, the biggest hurdle isn't running the ROI numbers; it's finding the upfront cash. This is where smart financing becomes a game-changer for growth. Instead of wiping out your working capital on one big purchase, financing lets you spread the cost out into manageable monthly payments.
This strategy has some major perks:
- Preserves Your Cash Flow: You keep your cash free for daily needs like payroll and inventory, which is absolutely vital for staying financially healthy.
- Immediate Profitability: You start reaping the benefits of the new, efficient equipment right away. Often, the monthly savings from the new machine are actually higher than the financing payment, making the upgrade profitable from day one.
- Predictable Budgeting: Fixed monthly payments make forecasting your expenses a breeze. No surprises.
By treating equipment as a strategic investment and using financing wisely, you can constantly improve your kitchen's efficiency without putting your business's financial health on the line. If you're looking to explore this, you can learn more about financing restaurant equipment in our article, which breaks down all the options for Southern California operators. This proactive approach to managing your assets is a true hallmark of the most profitable restaurants.
Digging into Your Restaurant Profit Margins: Common Questions
Once you’ve run the numbers through a restaurant profit margin calculator, the real work begins. Staring at those percentages in black and white almost always sparks more questions than answers, especially for operators here in Los Angeles and Orange County. It’s the moment you shift from just doing the math to making strategic decisions for your business.
Let's walk through some of the most common questions I hear from restaurant owners—whether they run a Los Angeles pizza place, food truck, or Mexican restaurant—after they get their first real look at the numbers. Getting these answers straight will help you navigate the financial side of your restaurant with a lot more confidence.
How Often Should I Be Calculating My Profit Margin?
For a big-picture, strategic look at your restaurant's health, you need to be calculating your full net profit margin every single month. This is the ideal rhythm. It's frequent enough to see trends developing and to measure whether recent changes—like that menu price hike or a new social media campaign for your pizzeria—are actually working.
Think of it as your monthly financial health check. But let's be real, you can't wait 30 days to find out you're bleeding cash. That’s why the sharpest operators I know also do a weekly prime cost check.
Your prime cost is simply the total of your Cost of Goods Sold (COGS) and all your labor costs. Since food and people are your two biggest (and most unpredictable) expenses, getting a weekly pulse on them is like an early warning system. It lets you make quick fixes to staffing schedules or purchasing before a small leak turns into a flood for the month.
What’s the Biggest Mistake People Make With These Calculators?
Hands down, the single most common mistake is forgetting all the small stuff. I’ve seen it happen more times than I can count. A food truck owner in Los Angeles will track every penny spent on avocados and payroll, but then completely ignore the smaller, recurring overhead costs that quietly eat away at their profit.
It's those "hidden" costs—the POS system fees, bank charges, software subscriptions, pest control, and that surprise plumbing bill—that add up way faster than you’d think. They can easily flip what looks like a profitable month on paper into a loss, giving you a dangerously rosy picture of your financial health.
A single forgotten expense can literally be the difference between making money and losing it. When you use a restaurant profit margin calculator, your list of operating expenses has to be complete. If you write a check for it, it belongs in the calculation.
Is It Possible to Have a High Gross Profit but a Low Net Profit?
Absolutely. In fact, this is one of the most common—and frustrating—situations a restaurant owner can find themselves in. A high gross profit margin is a great sign! It means your menu is priced right and your kitchen is keeping food costs in line. Your core product is a winner.
But that beautiful gross profit can get completely devoured by out-of-control operating costs. Think about a popular Mexican food spot in LA with a 70% gross margin on its food. That's fantastic. But what if their rent in a prime downtown location is sky-high? Or their utility bills are through the roof?
This scenario is exactly why you have to track both margins. It’s non-negotiable.
- Gross Margin tells you if your menu is profitable.
- Net Margin tells you if your business is profitable.
Looking at one without the other only gives you half the story. The gap between those two numbers points you directly to where your operational leaks are.
How Does Buying New Equipment Affect My Margins?
New restaurant equipment isn't just a cost; it's a direct investment in your profit margin. That modern, energy-efficient convection oven for your pizza kitchen doesn't just cook faster—it also shrinks your monthly utility bill and lets you push more pizzas out the door with the same amount of staff.
It's the same story with a new pizza prep table that has better refrigeration. It can dramatically cut your food waste by keeping toppings fresh longer, which directly lowers your COGS. Every piece of equipment, from a new fryer to a walk-in cooler, has a direct impact on your labor costs, utility bills, and food waste—all major lines on your profit and loss statement.
Ready to equip your restaurant for maximum profitability? At LA Restaurant Equipment, we provide Southern California's independent restaurants, food trucks, and pizzerias with top-quality, warranty-backed commercial kitchen equipment at warehouse-direct prices. https://larestaurantequipment.com